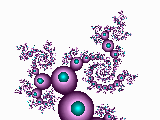
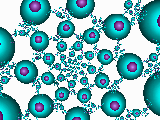
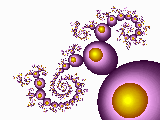
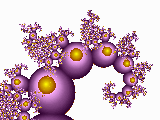
South Wing: Gallery of Fractal Bubbles
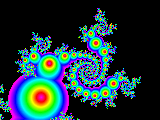
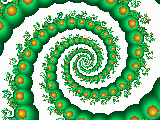
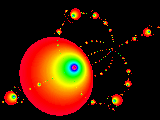
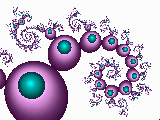
The images in this group were all created using the standard Mandelbrot equation zn+1 = zn² + c. The images were created in two passes. On the first pass, the minimum value of the modulus of z obtained in the iteration loop for each pixel was converted to a colormap index, and the pixel was plotted using that color. When the first pass was complete the program would pause until the author clicked the mouse with the cursor over a pixel, say pixel a, in the image. The minimum modulus of z for pixel a was computed and then a second pass was made in which all pixels having a minimum modulus of z less than that of pixel a were plotted in the background color. Here are a few images (480 x 640 x 256 colors) selected from Mr. Carlson's very large collection.
